Planningboard: Customizable Statistics and Capacity Indicators
TABLE OF CONTENTS
- Planningboard: Customizable Statistics and Capacity Indicators
1. Introduction
The Nextedy Planningboard now supports fully customizable statistics and capacity indicators. Administrators can tailor progress bars, column tooltips, and work item card content through JavaScript configuration scripts, without modifying source code or deploying custom extensions.
This document covers the four customization areas:
- Column Progress Bar Template - customize the progress bar shown in plan/iteration headers
- Cell Progress Bar Template - customize per-user progress bars in individual cells
- Column Tooltip Template and Data Script - customize tooltip content with computed data
- Work Item Card Customization - show per-assignee remaining capacity on each card
All customizations follow a two-phase pattern:
(1) a server-side Data Script computes custom data from work items and stores it in userData.
(2) a client-side Template function reads userData to render the visual output.
This separation keeps heavy computation on the server while keeping rendering fast on the client.
Please note, all samples below are shown in readable multi-line format, but when added to the Configuration Properties level, all shall be transformed into a single-line.
2. Configuration Methods
Every customization can be applied at two scopes:
2.1 Configuration Properties (All Boards)
Navigate to Administration > Configuration Properties (at the repository or project level) and add the appropriate property. This applies the customization to every Planningboard in that scope.
Property prefix: nextedy.planningboard.<propertyName>
2.2 Widget-Level Script (Single Board)
To customize only one specific Planningboard widget, edit the widget and add the script in the Additional Script (config script) field.
Property prefix: nextedy.planningboard.<propertyName>
DataScript can be added only to the Configuration Properties, while template script can be added to either of these.Note: When both are configured, the widget-level script takes precedence over Configuration Properties for that specific board. All other boards continue using the Configuration Properties value.3. Column Progress Bar Template
3.1 Overview
By default, each column (iteration/plan) in the Planningboard shows a progress bar with four fixed segments: green for done work, blue for planned work, red for over-planned work, and gray for available capacity.
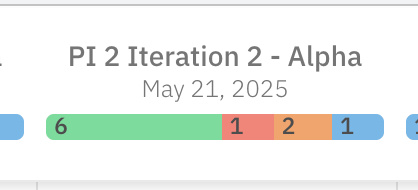
The Column Progress Bar Template lets you replace this default bar with custom segments. You choose how many segments to show, what values they represent, and what colors they use.
3.2 Configuration
Option 1: Configuration Properties
nextedy.planningboard.columnProgressBarTemplate = function(plan) {

    return [
        [plan.userData.doneCount,     "#2ecc71"],
        [plan.userData.invalidCount,  "#e74c3c"],
        [plan.userData.rejectedCount, "#e67e22"],
        [plan.userData.todoCount,     "#3498db"]
    ];
};
Option 2: Widget Additional Script
nextedy.planningboard.columnProgressBarTemplate = function(plan) {
    return [
        [plan.userData.doneCount,     "#2ecc71"],
        [plan.userData.invalidCount,  "#e74c3c"],
        [plan.userData.rejectedCount, "#e67e22"],
        [plan.userData.todoCount,     "#3498db"]
    ];
};
3.3 Function Input
Parameter | Description |
plan | The current iteration/plan object, including plan.userData with any custom data defined via columnDataScript. |
3.4 Return Value
The function must return an array of [value, color] pairs. Each pair defines one bar segment: the number sets its proportional width, and the color (hex or rgba string) sets its appearance. Segments with a value of 0 are automatically skipped.
3.5 How It Works with columnDataScript
The progress bar template works together with columnDataScript:
- columnDataScript runs first on the server side. It calculates custom data for each plan (e.g., counts of work items by status). The returned object is stored in plan.userData.
- columnProgressBarTemplate runs next on the client side. It receives the plan object and can access the custom data through plan.userData to decide how to render the bar.
3.6 Default Snippet (Replicates Built-in Behavior)
The following snippet produces output identical to the out-of-the-box progress bar:
nextedy.planningboard.columnProgressBarTemplate = function(column) {
  return [
    [column.done, "#21BA45"],
    [column.todo, "#2185D0"],
    [column.overflow, "#DB2828"],
    [column.available, "rgba(0,0,0,.25)"]
  ];
};
3.7 Advanced Example: Status-Based Progress Bar
This example shows a bar that separates done, invalid, rejected, and to-do items using a custom columnDataScript:
Step 1: Define the data script
nextedy.planningboard.columnDataScript = function(column, plan, config, api) {

    var items = plan.getItems();
    var iterator = items.iterator();
    var doneCount = 0, invalidCount = 0, rejectedCount = 0, todoCount = 0;

    while (iterator.hasNext()) {
        var wi = iterator.next();
        if (wi == null || wi.isUnresolvable()) continue;

        var resolution = wi.getResolution();
        if (resolution != null) {
            var resId = String(resolution.getId());
            if (resId === "invalid") invalidCount++;
            else doneCount++;
        } else {
            var status = wi.getStatus();
            if (status && String(status.getId()) === "rejected")
                rejectedCount++;
            else todoCount++;
        }
    }
    return { doneCount: doneCount, invalidCount: invalidCount,
             rejectedCount: rejectedCount, todoCount: todoCount };
};
Step 2: Define the bar template
nextedy.planningboard.columnProgressBarTemplate = function(plan) {
    return [
        [plan.userData.doneCount,     "#2ecc71"],
        [plan.userData.invalidCount,  "#e74c3c"],
        [plan.userData.rejectedCount, "#e67e22"],
        [plan.userData.todoCount,     "#3498db"]
    ];
};
3.8 Error Handling
If there is an error in your template, the board will not break. Instead, it shows a red error bar with a description of what went wrong in the tooltip. Check the browser console for more details.
4. Cell Progress Bar Template
4.1 Overview
When User Capacity Load is enabled, each cell (the intersection of a user row and a plan column) shows a progress bar. By default, it uses the same 4-segment layout as the column bar (done, planned, over-planned, available).
The Cell Progress Bar Template lets you replace this per-cell bar with custom segments.
4.2 Configuration
Option 1: Configuration Properties
nextedy.planningboard.cellProgressBarTemplate = function(plan, resource, events) {
    ...
};
Option 2: Widget Additional Script
nextedy.planningboard.cellProgressBarTemplate = function(plan, resource, events) {
    return [
        [plan.userData.doneCount,     "#2ecc71"],
        [plan.userData.invalidCount,  "#e74c3c"],
        [plan.userData.rejectedCount, "#e67e22"],
        [plan.userData.todoCount,     "#3498db"]
    ];
};
4.3 Function Inputs
Parameter | Type | Description |
plan | Object | Current iteration/plan object, including plan.userData from columnDataScript. |
resource | Object | Current user/resource for this cell row. Contains resource.resource (resource ID). |
events | Array | Work items assigned to this specific user in this specific plan. |
4.4 Return Value
Same format as columnProgressBarTemplate: an array of [value, color] pairs.
4.5 Default Snippet
nextedy.planningboard.cellProgressBarTemplate = function(column, resource, events) {
  return [
    [column.done, "#21ba45"],
    [column.todo, "#2185d0"],
    [column.overflow, "#db2828"],
    [column.available, "rgba(0,0,0,.25)"]
  ];
};
4.6 Example: Count Done and other tasks for each assignee
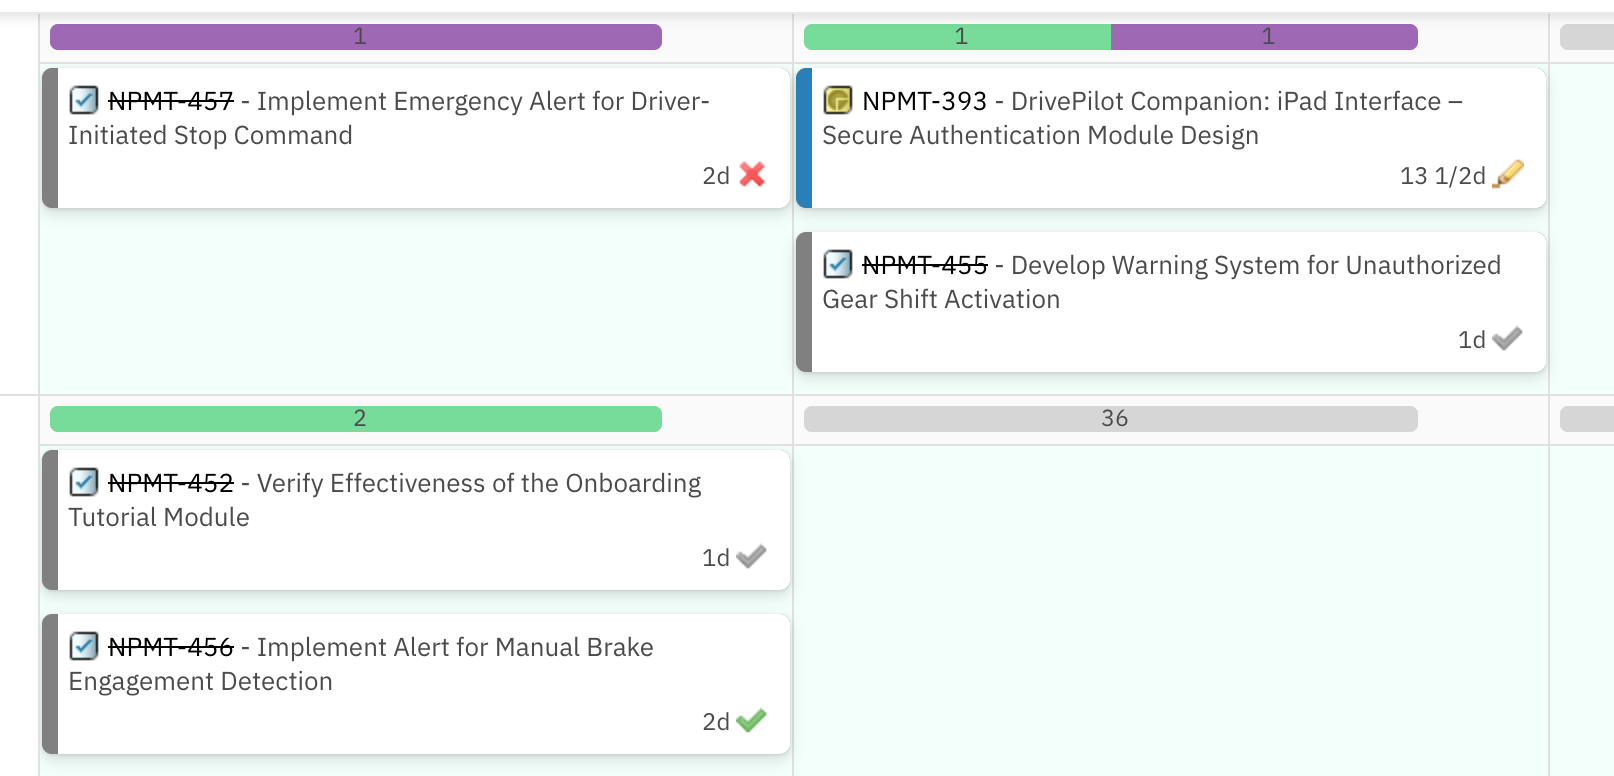
This example shows how to configure the progress bar template that counts items in Done status or Done resolution as green items, and the rest of the items in any status or other resolution separately in purple color:
nextedy.planningboard.cellProgressBarTemplate = function(plan, resource, events) {
    var done = 0, todo = 0;
    for (var i = 0; i < events.length; i++) {
        if (events[i].status === "done") done++;
        else todo++;
    }
    return [[done, "#2ecc71"], [todo, "#752696"]];
};
Add with columnDataScript:
nextedy.planningboard.columnDataScript = function(column, plan, config, api) {
    var items = plan.getItems(),
        iterator = items.iterator(),
        statusMap = {};

    while (iterator.hasNext()) {
        var wi = iterator.next();
        if (wi == null || wi.isUnresolvable()) continue;

        var itemId = String(wi.getId()),
            resolution = wi.getResolution();

        if (resolution != null) {
            statusMap[itemId] = String(resolution.getId());
        } else {
            var status = wi.getStatus();
            statusMap[itemId] = status ? String(status.getId()) : "unknown";
        }
    }

    return { statusMap: statusMap };
};
Result: As a result, items with DONE resolution get counted as Done items (green), while all other items get counted as TODO (purple items).
4.7 Relationship to columnProgressBarTemplate
- columnProgressBarTemplate controls the bar in the plan/iteration header.
- cellProgressBarTemplate controls bars in individual user cells.
- Both can use plan.userData from columnDataScript, but only cellProgressBarTemplate receives the resource and events parameters.
5. Column Tooltip and Data Script
5.1 Overview
The column tooltip appears when a user hovers over a plan/iteration column header. By default, it shows built-in capacity statistics. Using the columnDataScript and columnTooltipTemplate, administrators can replace this tooltip with fully custom content.
5.2 Two-Part Configuration
columnDataScript (Server-Side)
Runs on the server for each plan column. It iterates over work items, computes aggregated data, and returns a result object. This object is attached to the column as column.userData and is available to both the tooltip template and the progress bar template.
columnTooltipTemplate (Client-Side)
Runs in the browser. Receives the column object (with userData populated by the data script) and returns an HTML string that is rendered as the tooltip content.
5.3 Data Script Function Signature
nextedy.planningboard.columnDataScript = function(column, plan, config, api) {
    // column - the plan column object
    // plan   - Polarion plan with getItems(), getStartDate(), getDueDate()
    // config - board configuration (hoursPerDay, capacityField, etc.)
    // api    - API access object (api.teamsService for capacity queries)
    return { /* custom data */ };
};
5.4 Tooltip Template Function Signature
nextedy.planningboard.columnTooltipTemplate = function(column, row) {
    var data = column.userData;
    return "<div>" + /* HTML content */ + "</div>";
};
5.5 Default Tooltip Snippet
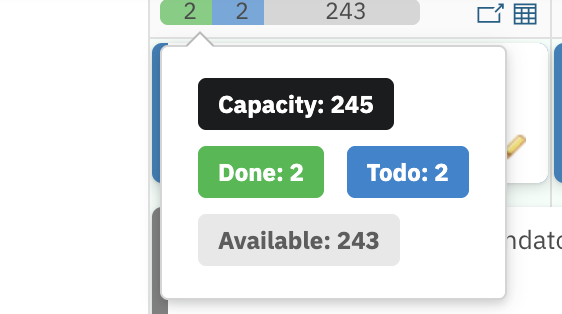
Replicates the built-in tooltip behavior (Capacity / Done / Todo / Available):
// Tooltip template
nextedy.planningboard.columnTooltipTemplate = function(column, row) {
  return "<div>" +
    "<div class='ui label black tooltipNumber'>Capacity: "
      + column.userData.capacity + "</div><br/>" +
    "<div class='ui label green tooltipNumber'>Done: "
      + column.userData.done + "</div>" +
    "<div class='ui label blue tooltipNumber'>Todo: "
      + column.userData.todo + "</div><br/>" +
    "<div class='ui label gray tooltipNumber'>Available: "
      + column.userData.available + "</div></div>";
};


// Data script
nextedy.planningboard.columnDataScript = function(column, plan, config, api) {
    var todo = 0, done = 0;
    var capacity = column.capacity;
    var hoursPerDay = config.hoursPerDay;
    var items = plan.getItems();
    var iterator = items.iterator();
    while (iterator.hasNext()) {
        var wi = iterator.next();
        if (wi == null || wi.isUnresolvable()) continue;
        var spent = wi.getTimeSpent();
        if (spent != null)
            done += Math.round(spent.getHours() / hoursPerDay);
        var remaining = wi.getRemainingEstimate();
        if (remaining != null)
            todo += Math.round(remaining.getHours() / hoursPerDay);
    }
    return { done: done, todo: todo, capacity: capacity,
             available: capacity - done };
};
5.6 Example: Per-User Capacity Tooltip (Advanced)
This configuration displays per-user remaining capacity within the tooltip, showing each team member with their available, allocated, and total capacity for the plan timeframe. It uses the Teams Service API to query user capacity scoped to the plan date range.
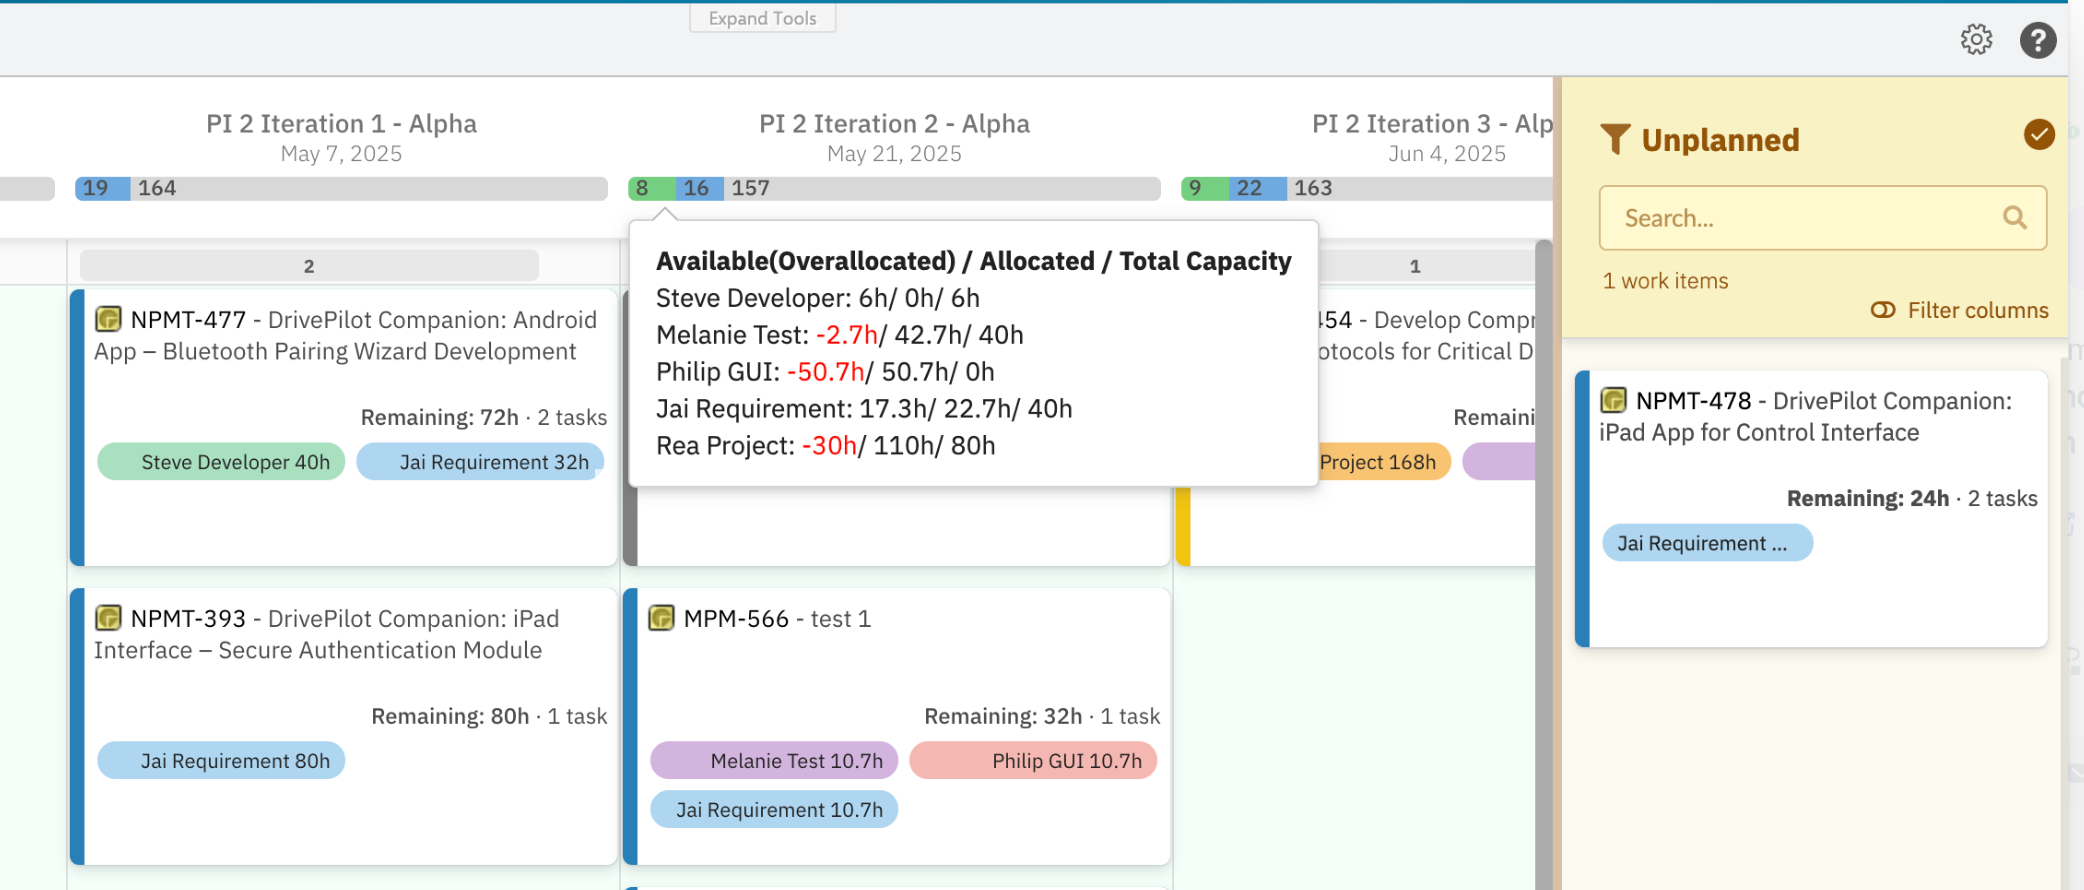
The tooltip renders each user in the format:
UserName: Available(Overallocated)/ Allocated/ Total Capacity
Overallocated values (negative available capacity) are highlighted in red. The data script collects child task items of planned work packages, aggregates effort per assignee (splitting equally for multi-assignee tasks), and queries per-user total capacity from the Teams Service.
nextedy.planningboard.columnTooltipTemplate = function (column, row) {
  let userData = column && column.userData;

  let html = '<div style="display:inline-block; white-space:nowrap;">';
  html += '<b>Available(Overallocated)/ Allocated/ Total Capacity</b><br/>';

  let userCapacities = userData && userData.userCapacities;

  if (userCapacities && userCapacities.length) {
    html += userCapacities
      .map(function (u) {
        let availableCapacity = Number(u.availableCapacity || 0);
        let allocatedCapacity = Number(u.allocatedCapacity || 0);
        let totalCapacity = Number(u.totalCapacity || 0);

        let available =
          availableCapacity < 0
            ? '<span style="color:red">' + availableCapacity + 'h</span>'
            : availableCapacity + 'h';

        return (
          u.userName +
          ': ' +
          available +
          '/ ' +
          allocatedCapacity +
          'h/ ' +
          totalCapacity +
          'h'
        );
      })
      .join('<br/>');
  }

  html += '</div>';

  return html;
};

nextedy.planningboard.columnDataScript = function (column, plan, config, api) {
  function getEffort(wi) {
    if (config.capacityField) {
      let val = wi.getValue(config.capacityField);

      if (val != null) {
        let n = Number(val);
        return isNaN(n) ? 0 : n * (config.hoursPerDay || 8);
      }

      return 0;
    }

    let re = wi.getRemainingEstimate();

    if (re) {
      return re.getHours();
    }

    let ie = wi.getInitialEstimate();

    if (ie) {
      let ts = wi.getTimeSpent();
      return Math.max(ie.getHours() - (ts ? ts.getHours() : 0), 0);
    }

    return 0;
  }

  let allChildTasks = [];
  let items = plan.getItems();
  let itemIterator = items.iterator();

  while (itemIterator.hasNext()) {
    let planItem = itemIterator.next();

    if (planItem && !planItem.isUnresolvable()) {
      let backLinks = planItem.getLinkedWorkItemsStructsBack();
      let linkIterator = backLinks.iterator();

      while (linkIterator.hasNext()) {
        let link = linkIterator.next();
        let linkRole = link.getLinkRole();

        if (linkRole && linkRole.getId() === 'implements') {
          let child = link.getLinkedItem();

          if (
            child &&
            !child.isUnresolvable() &&
            child.getType() &&
            child.getType().getId() === 'task'
          ) {
            allChildTasks.push(child);
          }
        }
      }
    }
  }

  let assigneeMap = {};
  let allocatedMap = {};
  let childRemainingEstimate = 0;

  for (let k = 0; k < allChildTasks.length; k++) {
    let childTask = allChildTasks[k];
    let effort = getEffort(childTask);

    childRemainingEstimate += effort;

    let assignees = childTask.getAssignees();

    if (assignees && assignees.size && assignees.size() > 0) {
      let splitEffort = effort / assignees.size();
      let assigneeIterator = assignees.iterator();

      while (assigneeIterator.hasNext()) {
        let assignee = assigneeIterator.next();
        let userId = String(assignee.getId());

        assigneeMap[userId] ||
          ((assigneeMap[userId] = assignee), (allocatedMap[userId] = 0));

        allocatedMap[userId] += splitEffort;
      }
    }
  }

  let userCapacities = [];
  let startDate = plan.getStartDate() ? plan.getStartDate().getDate() : null;
  let dueDate = plan.getDueDate() ? plan.getDueDate().getDate() : null;

  for (let id in assigneeMap) {
    if (assigneeMap.hasOwnProperty(id)) {
      let user = assigneeMap[id];
      let totalCapacity = 0;

      if (startDate && dueDate) {
        try {
          totalCapacity = Number(
            api.teamsService.getUserCapacity(
              id,
              config.selectedTeam,
              config.projectId,
              startDate,
              dueDate
            ) || 0
          );
        } catch (e) {
          totalCapacity = 0;
        }
      }

      let roundedTotal = Math.round(totalCapacity * 10) / 10;
      let roundedAllocated = Math.round((allocatedMap[id] || 0) * 10) / 10;

      userCapacities.push({
        userId: id,
        userName: user.isUnresolvable() ? id : user.getName(),
        totalCapacity: roundedTotal,
        allocatedCapacity: roundedAllocated,
        availableCapacity:
          Math.round((roundedTotal - roundedAllocated) * 10) / 10,
      });
    }
  }

  return {
    userCapacities: userCapacities,
    childRemainingEstimate: Math.round(childRemainingEstimate * 10) / 10,
    allChildTasksCount: allChildTasks.length,
    assigneeCount: userCapacities.length,
  };
};
Note: The data script uses api.teamsService.getUserCapacity(userId, teamId, projectId, startDate, dueDate) to retrieve capacity scoped to the plan timeframe. This requires that Teams are properly configured in the Polarion project and that the board has a selected team (config.selectedTeam).
6. Work Item Card Customization
Check the dedicated article below to learn more about card customization:
7. API Reference
7.1 columnDataScript Parameters
Parameter | Type | Description |
column | Object | Plan column object with built-in properties (capacity, done, todo, etc.). |
plan | Polarion Plan | Server-side plan object. Methods: getItems(), getStartDate(), getDueDate(). |
config | Object | Board configuration: hoursPerDay, capacityField, selectedTeam, projectId. |
api | Object | API access. Currently provides api.teamsService for capacity queries. |
7.2 Teams Service API
api.teamsService.getUserCapacity(userId, teamId, projectId, startDate, dueDate)
Returns: Number (total capacity in hours for the given date range)
7.3 Work Item Methods (in Data Scripts)
Method | Description |
plan.getItems() | Returns an iterable of planned work items. |
wi.getStatus() | Returns the work item status object (call .getId() for string ID). |
wi.getResolution() | Returns the resolution object, or null if unresolved. |
wi.getTimeSpent() | Returns a duration object. Call .getHours() for numeric value. |
wi.getRemainingEstimate() | Returns a duration object for remaining work. |
wi.getInitialEstimate() | Returns the original estimate duration. |
wi.getAssignees() | Returns the list of assigned users. |
wi.getLinkedWorkItemsStructsBack() | Returns back-linked items (children via parent role). |
wi.isUnresolvable() | Returns true if the item cannot be resolved (e.g., deleted). |
7.4 Item Script Context (Card Customization)
Object | Description |
wi | The current work item being rendered on the card. |
config | Board configuration including parentRole, hoursPerDay, capacityField. |
service | Utility service. Provides getItemEffortHours(wi, config). |
cli | Output object. Set cli.fieldsLine to an HTML string to render on the card. |
8. Best Practices
- Start with the default snippet: always begin by copying the default snippet that replicates built-in behavior, then modify incrementally.
- Test on a single board first: use the widget-level script (Option 2) to test changes on one board before promoting to Configuration Properties.
- Keep data scripts lightweight: heavy computation in columnDataScript can slow board loading.
- Use the Teams Service sparingly: getUserCapacity makes a server call per user. For boards with many users, consider caching strategies.
- Handle null values: always check for null/undefined before accessing properties like getTimeSpent(), getRemainingEstimate(), or getAssignees().
- Use isUnresolvable(): skip unresolvable items in all loops to avoid null pointer errors.
- Check the browser console: if a template function throws an error, the bar shows a red error indicator and details are logged to the console.
- Document your scripts: add comments explaining what each custom script does, especially for non-obvious resolution or status mappings.
9. Quick Reference: Property Names
Feature | Configuration Properties | Widget Script |
Column progress bar | nextedy.planningboard.columnProgressBarTemplate | nextedy.planningboard.columnProgressBarTemplate |
Cell progress bar | nextedy.planningboard.cellProgressBarTemplate | nextedy.planningboard.cellProgressBarTemplate |
Column data script | nextedy.planningboard.columnDataScript | (via Configuration Properties) |
Column tooltip | nextedy.planningboard.columnTooltipTemplate | (via Configuration Properties) |
Card item script | (widget settings) | (widget settings) |
Was this article helpful?
That’s Great!
Thank you for your feedback
Sorry! We couldn't be helpful
Thank you for your feedback
Feedback sent
We appreciate your effort and will try to fix the article